Part 1, part 2, and part 3 of “My First Predictive Analytics Project” can be found…at those URLs I just linked to. Ready to read about predictive analytics encoding problems? Good. Let’s go.
If you’ve missed a few of these: we’ve discussed the types of problems a Market Basket Analysis is good for, how the dang thing works, and got a little teaser into some of the challenges you can face executing one…
If you’d like to catch up on these, you can find the links above.
Onwards.
In this post we’re looking at the main challenge in conducting a Market Basket Analysis: Ensuring your data is in the right format.
(Predictive analytics sure does come with a bunch of encoding challenges.)
To recap: A Market Basket Analysis finds the rule with the most lift.
This rule is a series of things (the more technical term is “factor” or “variable”) that associate strongly together. For example, whether your customer is from the Philippines and has a preference for blue paint, or from the US and likes red paint.
However, for this to work, your data has to be in binary form.
To extend that very random example…
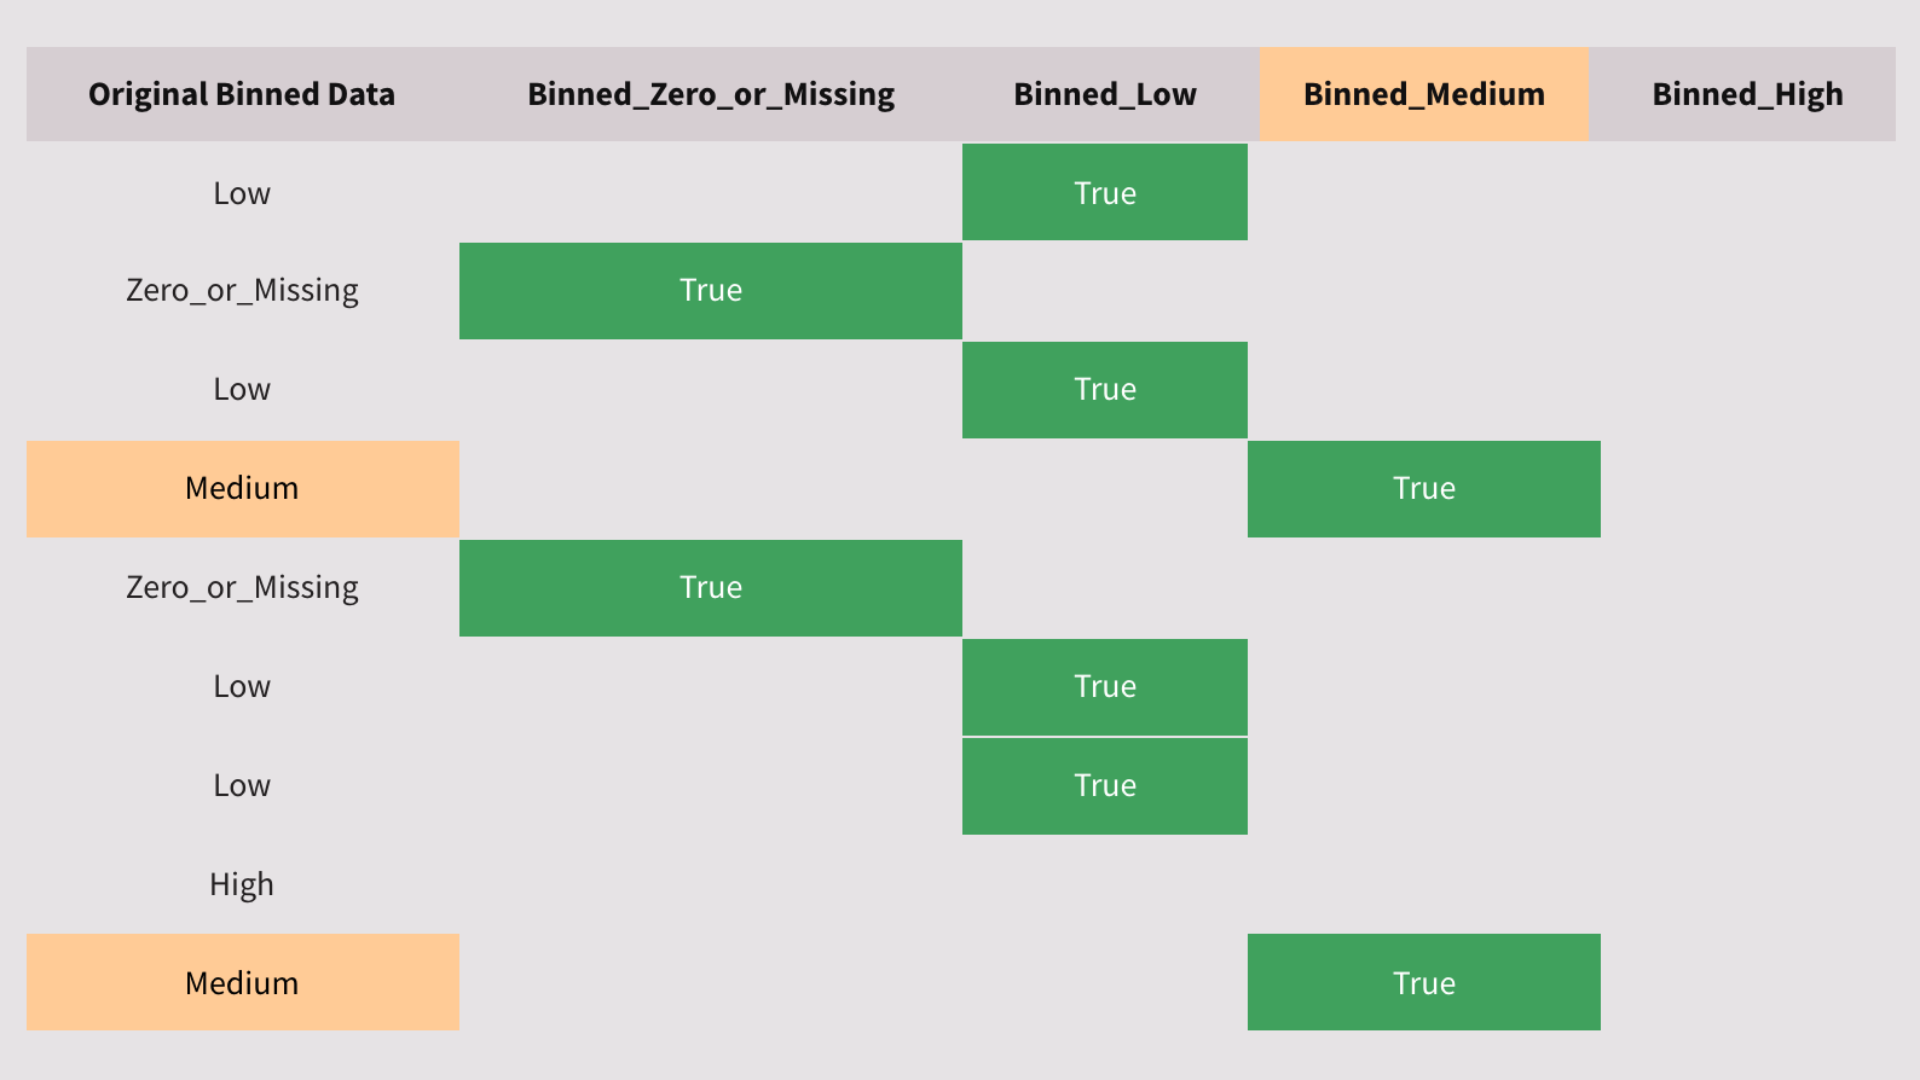
If each customer is a row in a spreadsheet, you can’t just have a single column for “Paint Preference”, which lists “red”, “pink”, or “periwinkle blue”1Said in the accent of Brad Pitts character in Snatch..
You’d need to have a column for every colour in your dataset, and the value of “True” or “False” for that customer.
This is called widening your dataset. Specifically, this is a “one-hot encode” of the data: The data is turned into a binary True or False form.
A dataset with three to five columns can turn into 20 to 100 columns if you’re not careful.
This can be hard to grasp. So I created a visual explainer of this problem in my write-up (it’s also a pretty piece of scrollytelling).
(Entire post is 29 minutes to read: so just read that excerpt).
Careful planning and preparation are needed—columns with continuous data need to be bucketed before you one-hot encode them. Columns with a hundred categories might need to be grouped into fewer categories.
If you don’t, you’ll face a long computation time with your analysis. As the number of columns goes up, the computation time goes up exponentially. To illustrate: 100 columns can take 10 minutes. 200 columns can take 2 hours. 300 columns can take a day…
Whoever said it would be easy?
But the best things in life usually aren’t. And a Market Basket Analysis is a pretty great thing in a Data person’s life.
We’ve looked at the challenges. Next time I’ll talk about the tools and techniques used to conduct the analysis.
Stay tuned.
This was first published on my LinkedIn.
You can read part 5 of this series here.