D3 is a b***h of a language1It’s actually a library, as someone kindly pointed out to me on hacker news, but as Churchill said, “don’t let the truth get in the way of a good story”. The semantics of calling it a language for this post gets the point across better than spending a while explaining that it’s a library, what a library is etc. at first glance. It’s long. It’s complicated and verbose. You have to enter what feels like an obscene amount of key strokes to draw one line.
I’m currently about one-third of the way through my journey of learning D3.js, having finished Interactive Visualisation for the Web by Scott Murray, and now picking my way through D3.js in Action by Elijah Meeks and Anne-Marie Dufour. (And just for kicks, I’m reading D3 for the Impatient by Philipp K Janert on the side whenever I have some free time).2Yeah, those are affiliate links. Don’t like it. Don’t click it. But if you like those books, would be nice to support this piece of writing by buying from them. My book fund will greatly appreciate it.
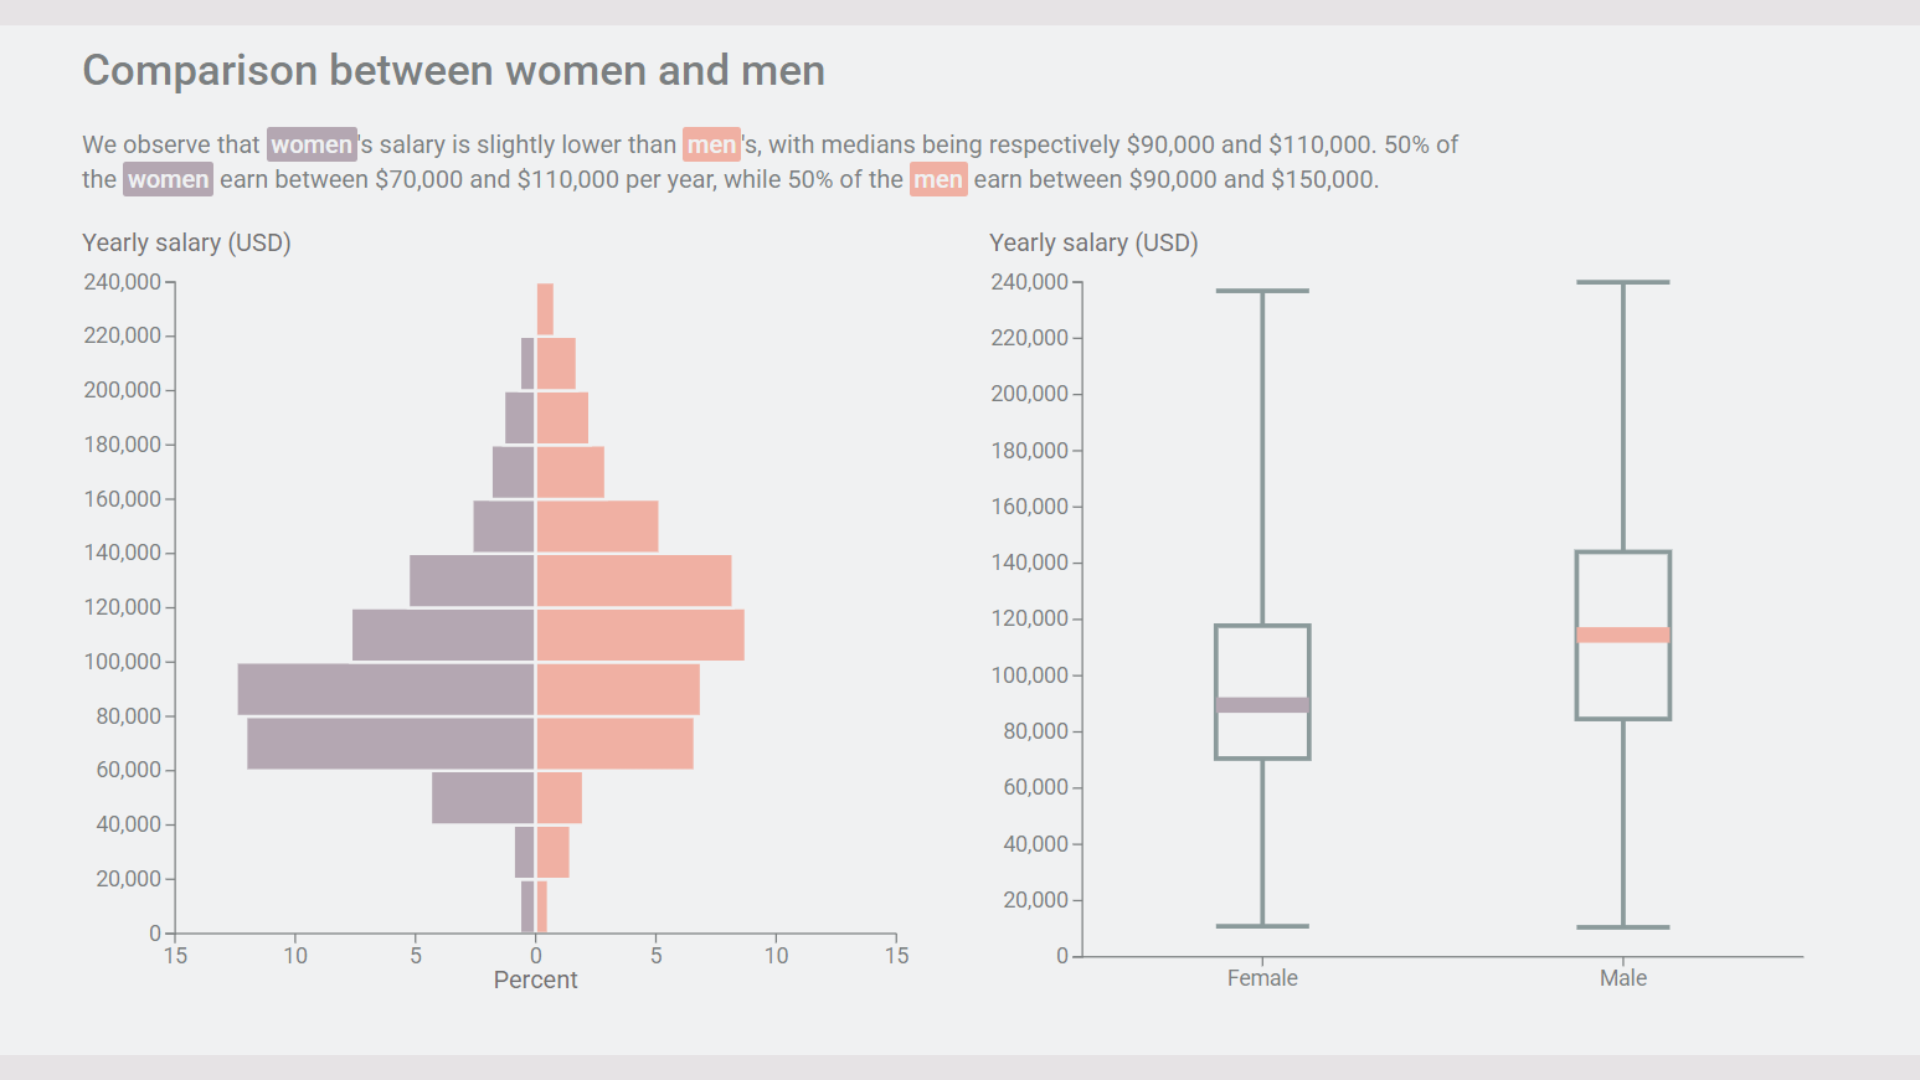
Which means, I just finished drawing a box plot from chapter 6. Yup. You know. That thing, you just make four or five clicks in Microsoft Excel, and voila, it appears. In a way that you don’t think is magical, because Excel has been around longer than the dial up modem.
I just shared this on my social media, and for the non-technical, I had to explain “hey, so, the reason why this is impressive is because…”


That’s 194 lines of code to draw a box plot. Why on earth would any masochist do this?
Because of the flexibility D3 provides.
The reason why there are so many lines is because:
- I’m doing this the long way. I could write some functions or components which could collapse a lot of those lines, but I’m still learning the ropes. Better to do it the long and manual way so I don’t skip anything
- This is important: D3 is a library which allows you to draw SVGs and bind them to data
All D3 is doing is saying “so, hey, I got all this data. Now. Dear browser. I’d like you to draw these SVG shapes, according to these instructions.”
SVG code reads like an extended HTML block of code. To draw a line on a two dimensional grid you have to define:
- x1 – the horizontal position of point 1
- x2 – the horizontal position of point 2
- y1 – the vertical position of point 1
- y2 – the vertical position of point 2
In D3 if I was just going to draw this with fixed values, say a line that goes from co-ordinates3If math co-ordinates scare you, just remember in school when your maths teacher told you “you must first run before you fly” for x being the first co-ordinate, and y being the second. (0,12) to (4,15):
aRandomNameForThisLine
  .append("line")
    .attr("x1", 0)
    .attr("x2", 4)
    .attr("y1", 12)
    .attr("y2", 15);
But the power comes from when I bind this to data:
boxplotContainer
  .append("line")
    .attr("x1", xScale(gender) - boxplotWidth/2)
      .attr("x2", xScale(gender) + boxplotWidth/2)
      .attr("y1", gender === "Female"
        ? yScale(femaleExtent[0])
        : yScale(maleExtent[0])
      )
      .attr("y2", gender === "Female"
        ? yScale(femaleExtent[0])
        : yScale(maleExtent[0])
      );
That block of code draws the bottom horizontal line of the box plot for each of those boxes, getting the values from the data, and adjusted for some other variables that I defined elsewhere.
It might seem long, but what’s great about it, is how much you can customise those values. You could make that line a curve if you want. Or you could add little tiny whiskers throughout, so your box plot starts to look like an unruly cat. Whatever. It’s up to you.
That’s what’s great about D3. It’s like drawing. Sure you can take a photograph, but isn’t it cooler to draw something, showing your interpretation of the object in question?
What I’m trying to say is:
D3 is verbose so you can create art.
With tools like datawrapper and flourish there’s little need these days to learn D3. However, you aren’t reading this because you want click and deploy tools.
You’re reading this because you’ve seen some of the great visualisations Data Visualisers have created out there. From scrollytelling to streamgraphs4Covid. Tragic subject. In spanish., or something unique 5Also about Covid.and special that has no name.6A year ago, I’d have been plugging other people’s work. But today I can plug one of my own. Allow me to be self-indulgent on this learning journey
And while some tools allow you to do some of that, D3 allows you to do it all.
And one day, on your learning journey, you’ll love how verbose it is.
Don’t mind me, just gonna plug my newsletter below:
D3 is verbose. This sign-up isn’t
If you’re here for deep clarity—not shortcuts—drop your email for crisp visual data essays that turn the complexity of life into insights.
Go one layer deeper
![]()
Sign up to read the exclusive three-part data story: London’s Affordability Crisis
Sign-up form not appearing above? Pesky javascript blocker… click here and scroll to the bottom for a vanilla boring mailchimp form that works on all devices.