Part 1, part 2, part 3, and part 4 can be found here. Ready to read about the tools you need to run a Market Basket Analysis? Great. Let’s go.
There are many challenges to running a Market Basket Analysis. So much, that I wrote a 29-minute write-up portfolio here: What is a Market Basket Analysis?
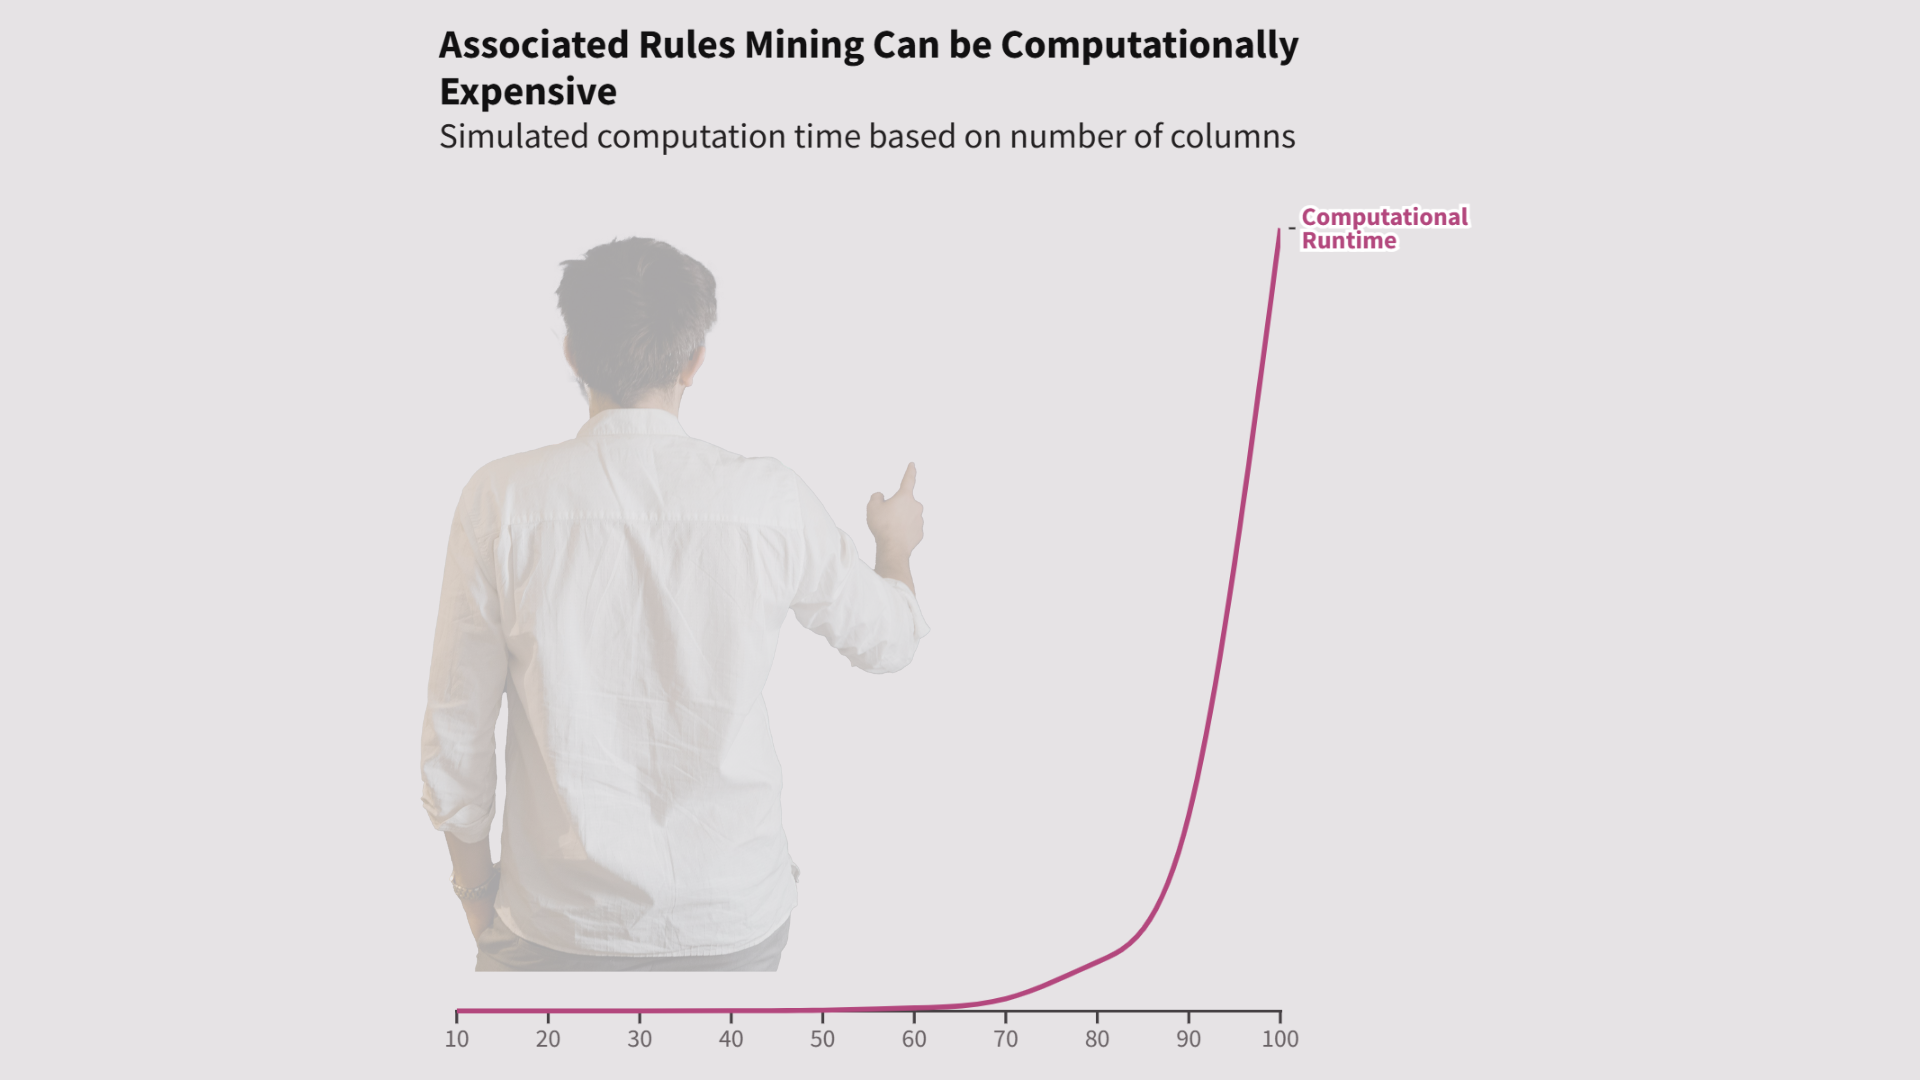
But enough about the challenges. Let’s talk about execution. Let’s look at the tools and techniques you can use to run a Market Basket Analysis.
If your data is prepped, all ready in a binary 1 or 0 (or True or False) form, you can carry out a Market Basket Analysis (or Association Rule Mining) in Excel using the Solver add-in.
There are plenty of tutorials on the internet for this. Use your favourite search engine to find them on the World Wide Web. And by your favourite, I mean Google. Not AskJeeves. Or Yahoo. Because let’s be honest: you’re using Google1If you’re using an LLM as your search engine these days, then have fun using it for tutorials. In my experience they’re still limited in this area. Better for problem solving micro queries. Also. How many 90s references to the internet can you find in that paragraph?.
The downside of using Excel is that you’ll only get one rule at the end. The rule with maximum lift.2For an explanation of the terms “rule” and “lift” see Part 3.**
For my project, I wanted multiple rules above a certain threshold. Why? Because these would give me context. Context I could use for further questions, further analysis, further insights.
Multiple rules can also provide perspective.
For example, let’s take the question: “What do customers who churn have in common?”. If, in your first five rules, you keep seeing the fact that they like pink paint, you can conclude that pink paint plays a large role in customer churn.
(I don’t know why I chose paint as an example. It was a random choice in the last post, but now I’m sticking with it.)
If you want to get multiple rules, you’ll need to leave Excel, and fire up your favourite code editor. You can do a Market Basket Analysis in R or Python.
The advantage of going down the coding route, is there are also off the shelf functions which can help encode your data.
I can somewhat program in Python, so the first library I used was pandas to wrangle the data. I used the qcut() function in pandas to categorise my continuous data, and then get_dummies() to one-hot encode the data.
After wrangling, I used the mlxtend library to run the Market Basket Analysis.
Oh, and a lot of trial and error.
There’s a lot more to this. Like how to tweak the thresholds of the analysis to get your desired insights.
Next time I’ll touch on that, and talk about the results of this project.
Stay tuned.
You can read part 6 of this series here.